Crown Street, Wollongong, 2500

Key Elements in Creating Effective Annual Report Design for Charities and Not-For-Profit Organisations
Melody Jaimon • November 3, 2024
Annual reporting for charities and not-for-profit organisations is a crucial process and it must be completed every year within three months of the Annual General Meeting (AGM). Australia is home to approximately 61,480 charities and not-for-profit organisations, all of which need to submit comprehensive annual reports that provide transparency to stakeholders and regulators.
For non-profits in the same sector as FOCUS Connect, the format of the annual report typically includes an overview of the organisation's activities and achievements over the past 12 months. Additionally, it features detailed reports from key staff and Responsible People, focusing on financial performance and governance. These reports highlight the organisation’s successes, financial management, and overall impact on the community.
The cost of producing these reports can vary based on several factors. The complexity of the report, including the number of pages, use of images, and inclusion of professionally designed graphs, can influence the overall pricing. Other considerations, such as the deadline for completion and whether the report needs to be WCAG2.1 compliant, also contribute to the final cost. The option for both printed and digital formats or a digital-only version may also affect the project scope.
Objective of Not-for-Profit Annual Reports
- Providing transparency and accountability
- Showcasing impact and achievements
- Financial reporting
- Building trust and confidence with stakeholders
- Engaging donors for continued support
- Reflecting on strategic progress and future goals
Designing an effective annual report ensures that organisations can present a professional, accessible, and compliant annual report that aligns with their mission and governance standards.
Let's explore the key elements involved in creating a successful annual report design.
1. Understand Your Audience
Before diving into the design, it’s crucial to consider your target audience. Who will be reading the report? Whether it’s donors, government agencies, or community members, the design should cater to their needs and preferences. For instance, some readers might be more interested in financial performance, while others might be drawn to stories of personal impact. Identifying the audience helps to determine the tone, layout, and content focus.
- Use plain language for the general public.
- Include detailed data for stakeholders with more expertise.
- Make it visually engaging for broader appeal.
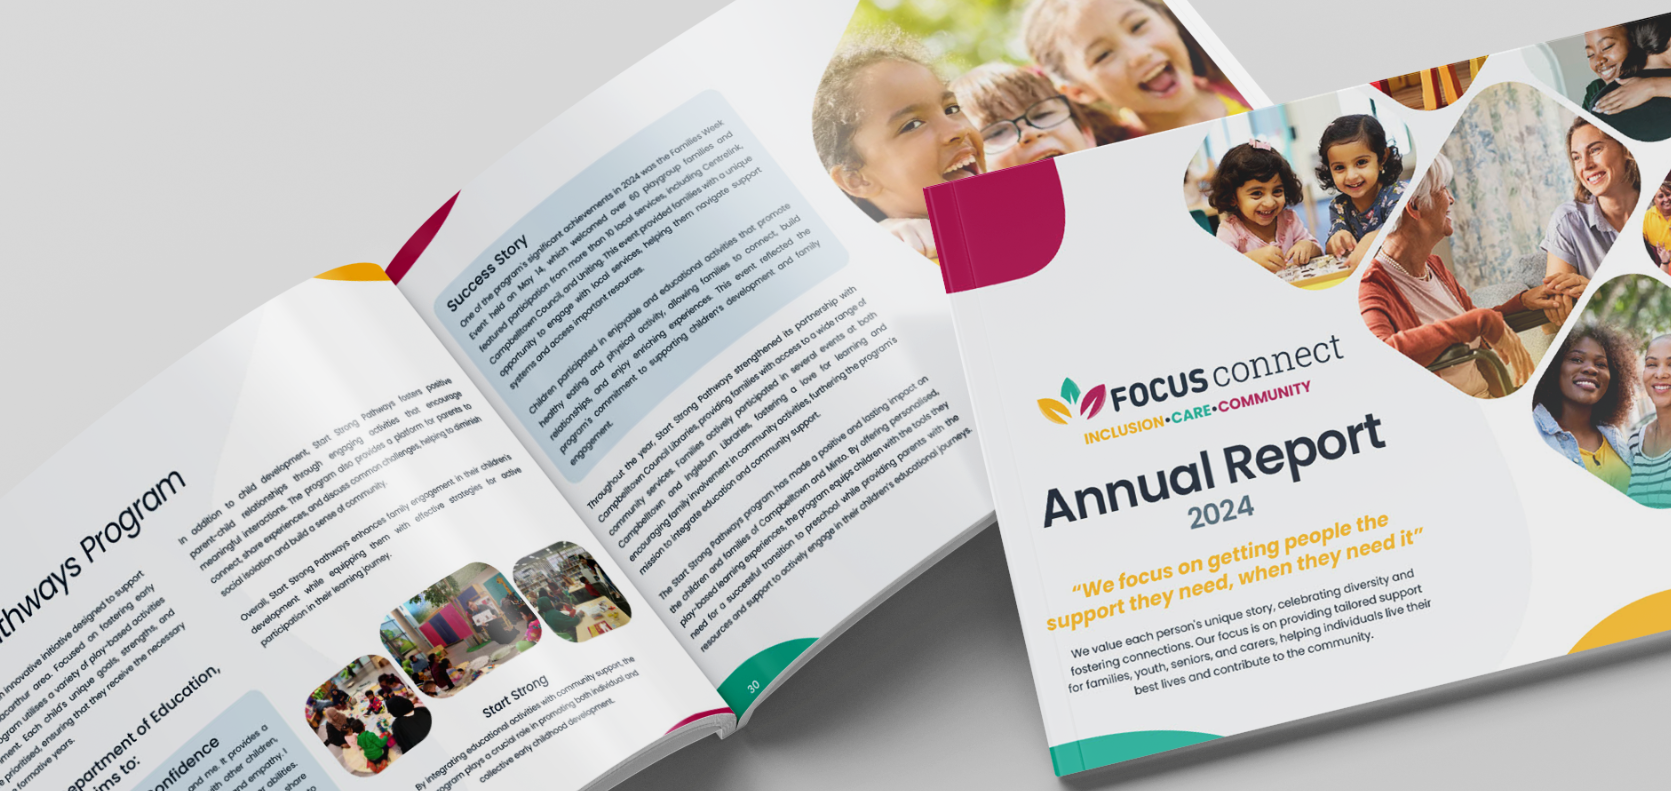
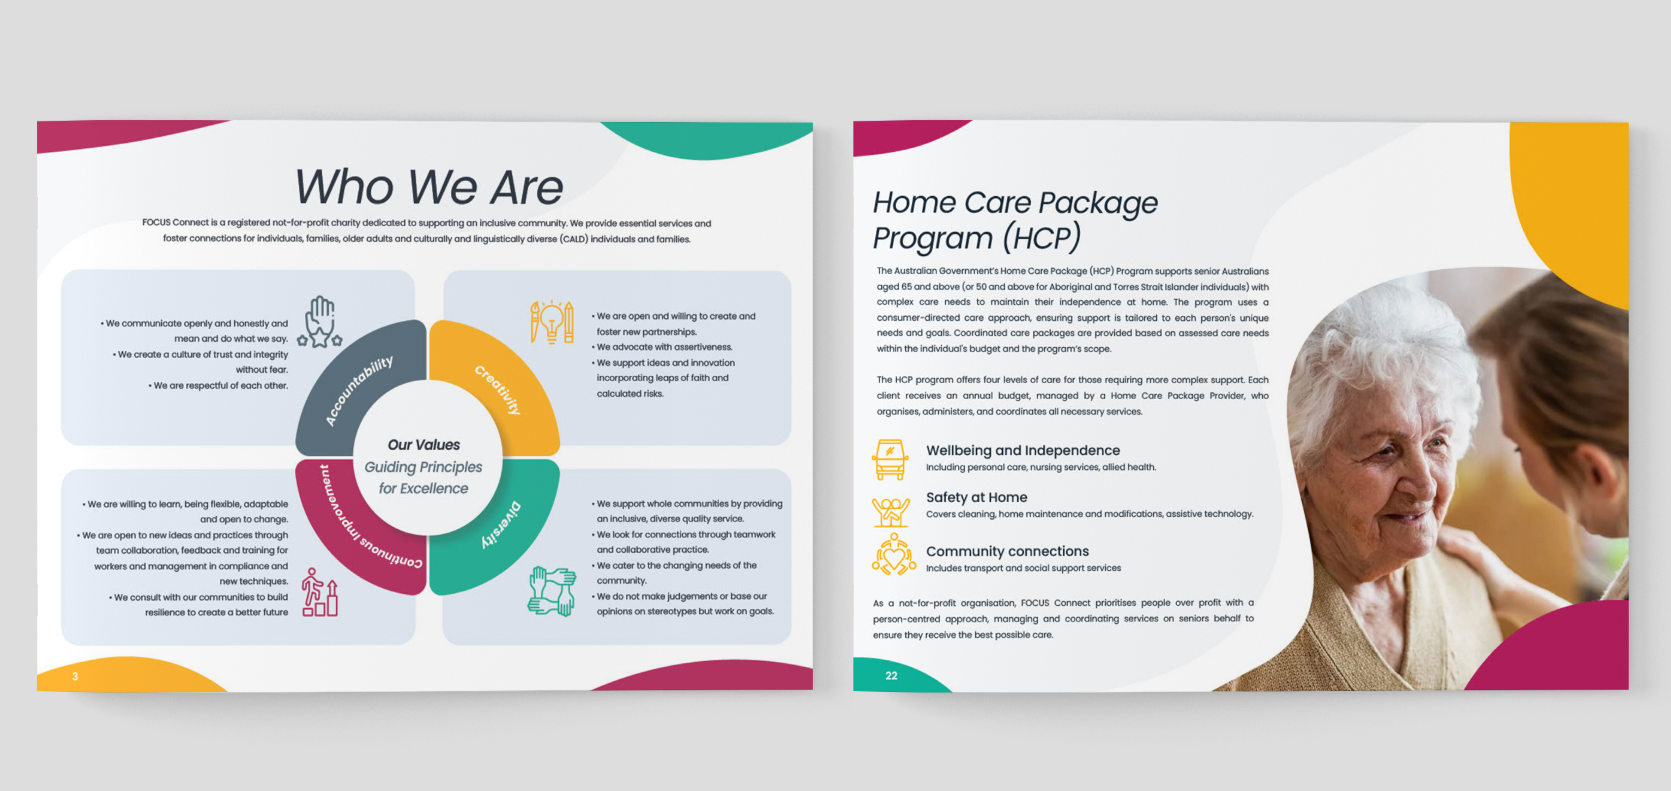
2. Strong Visual Identity
Your annual report should reflect your organisation’s brand and mission. A strong visual identity—consistent with your existing branding—ensures the report feels professional and trustworthy. Use your charity's logo, colours, and fonts throughout the report for consistency.
Key Considerations:
- Use the organisation’s colours to create visual cohesion.
- Incorporate professional typography that aligns with your brand.
- Ensure that images and design elements reflect your mission and community.
3. Compelling Storytelling
Charities and not-for-profits thrive on the stories behind their cause. Use your annual report to highlight the human aspect of your work. Include success stories, testimonials, and case studies to connect emotionally with readers. Personal stories and photos of beneficiaries can bring the data to life, giving stakeholders a tangible sense of your organisation's impact.
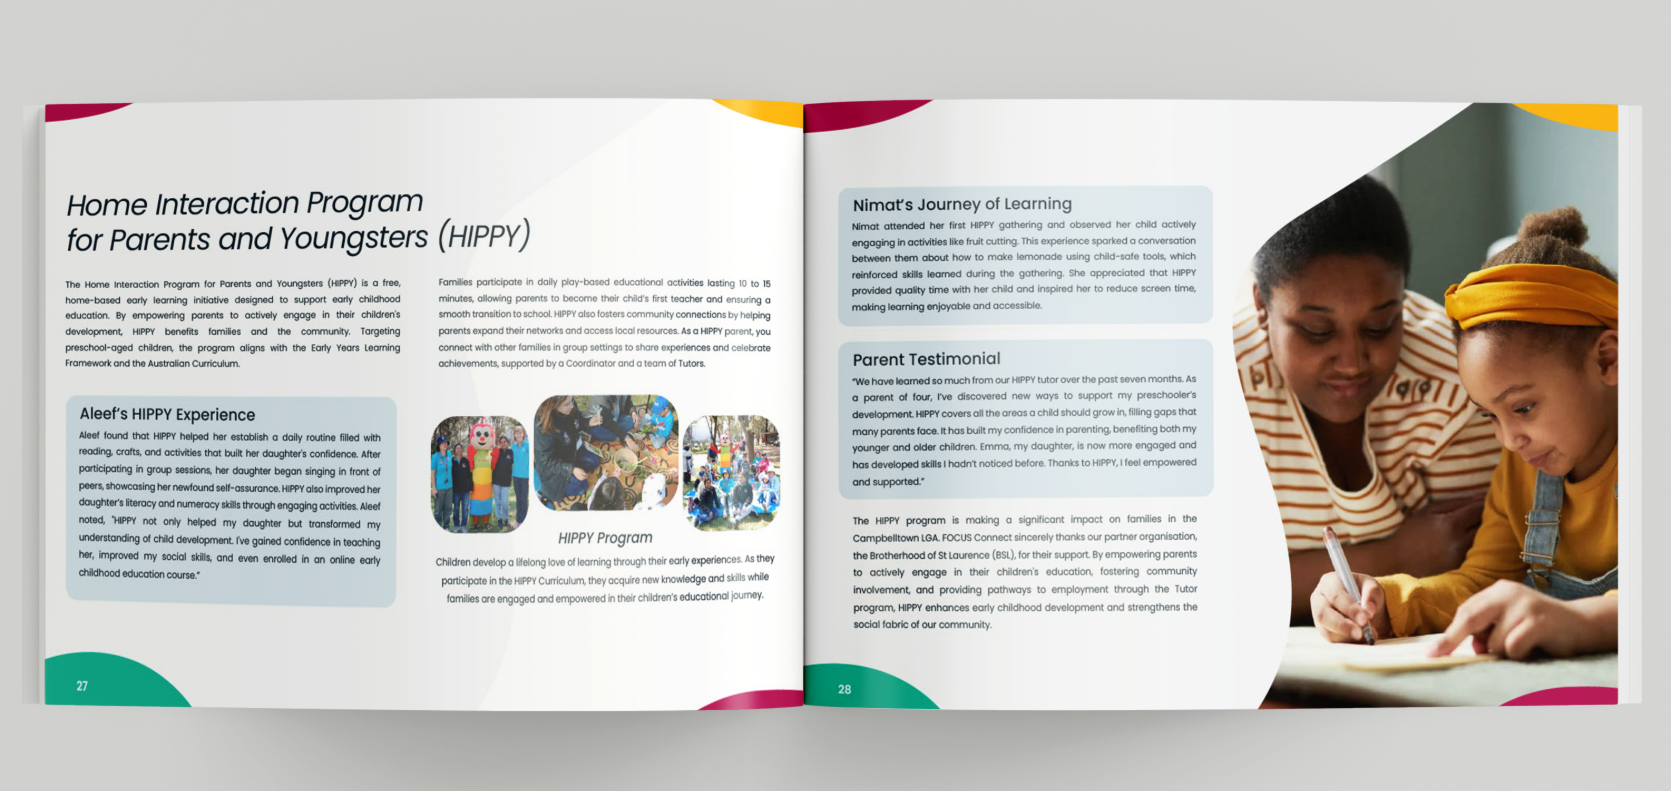
Ways to Integrate Storytelling:
- Dedicate a section to 'Impact Stories' or 'Voices from the Community'.
- Use quotes from those directly affected by your programs.
- Ensure a balance between narrative and visual elements.
4. Clear and Concise Financial Reporting
While the financial section can be daunting, it is one of the most important parts of the annual report. Keep it clear, concise, and transparent. Present financial data in a way that is easy to understand, using tables, charts, and infographics where necessary.
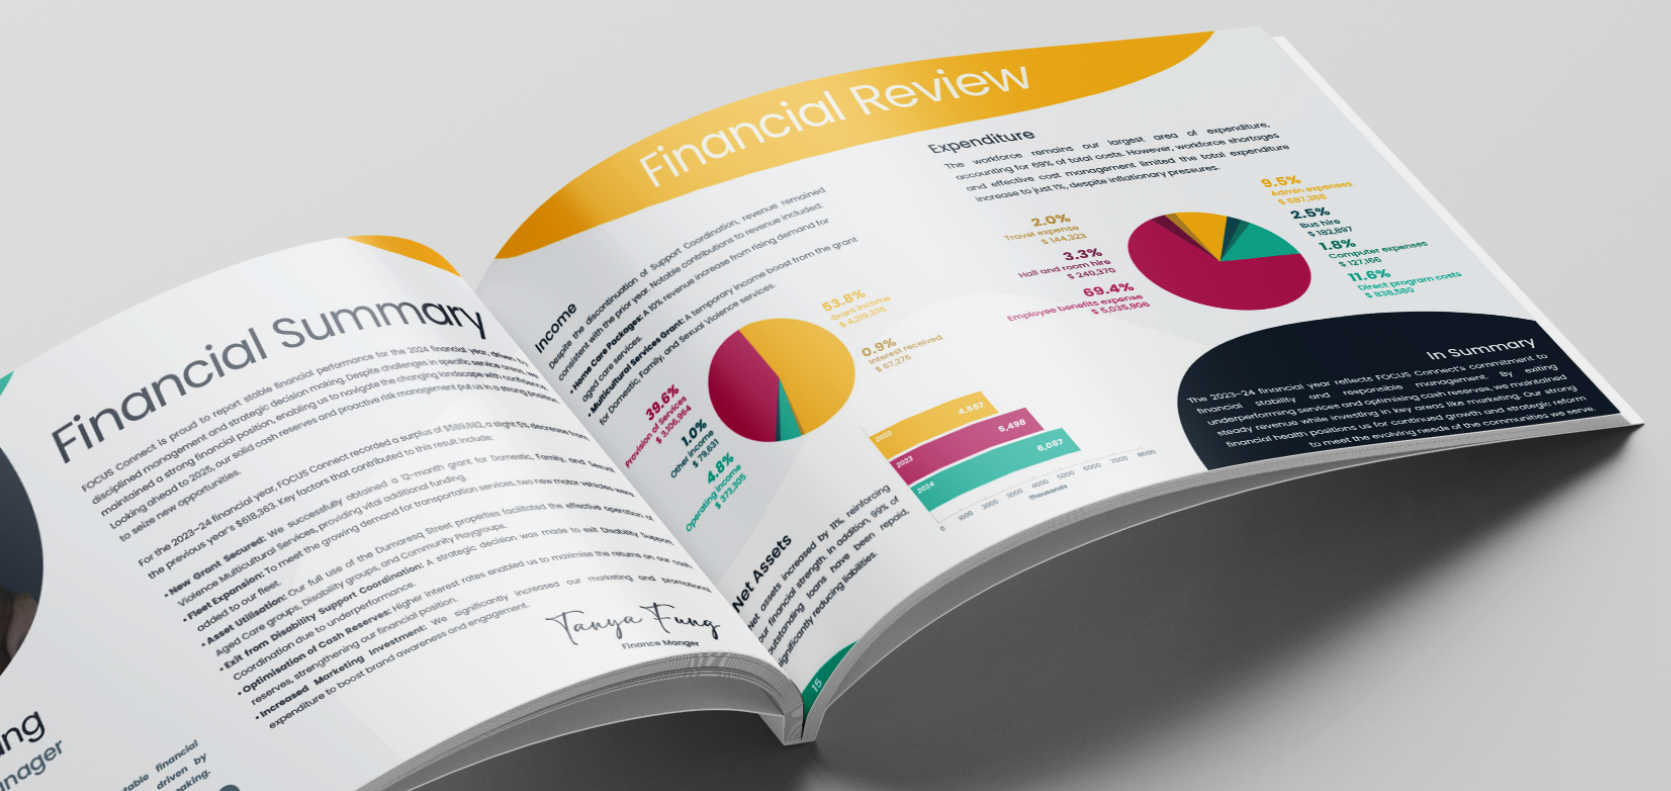
- Use pie charts or bar graphs to visualise income and expenses.
- Provide clear breakdowns of how donations are used.
- Include a summary of key financials for readers who may not delve into detailed figures.
5. Visual Hierarchy and Layout
The layout of your report should guide the reader through the content logically and easily. Use a visual hierarchy to structure the information. Headlines, subheadings, bullet points, and white space are critical for readability.
- Use larger fonts for key headings and bold text for important stats.
- Break text up with images, infographics, and sidebars.
- Keep the design clean to avoid overwhelming the reader with too much information on one page.
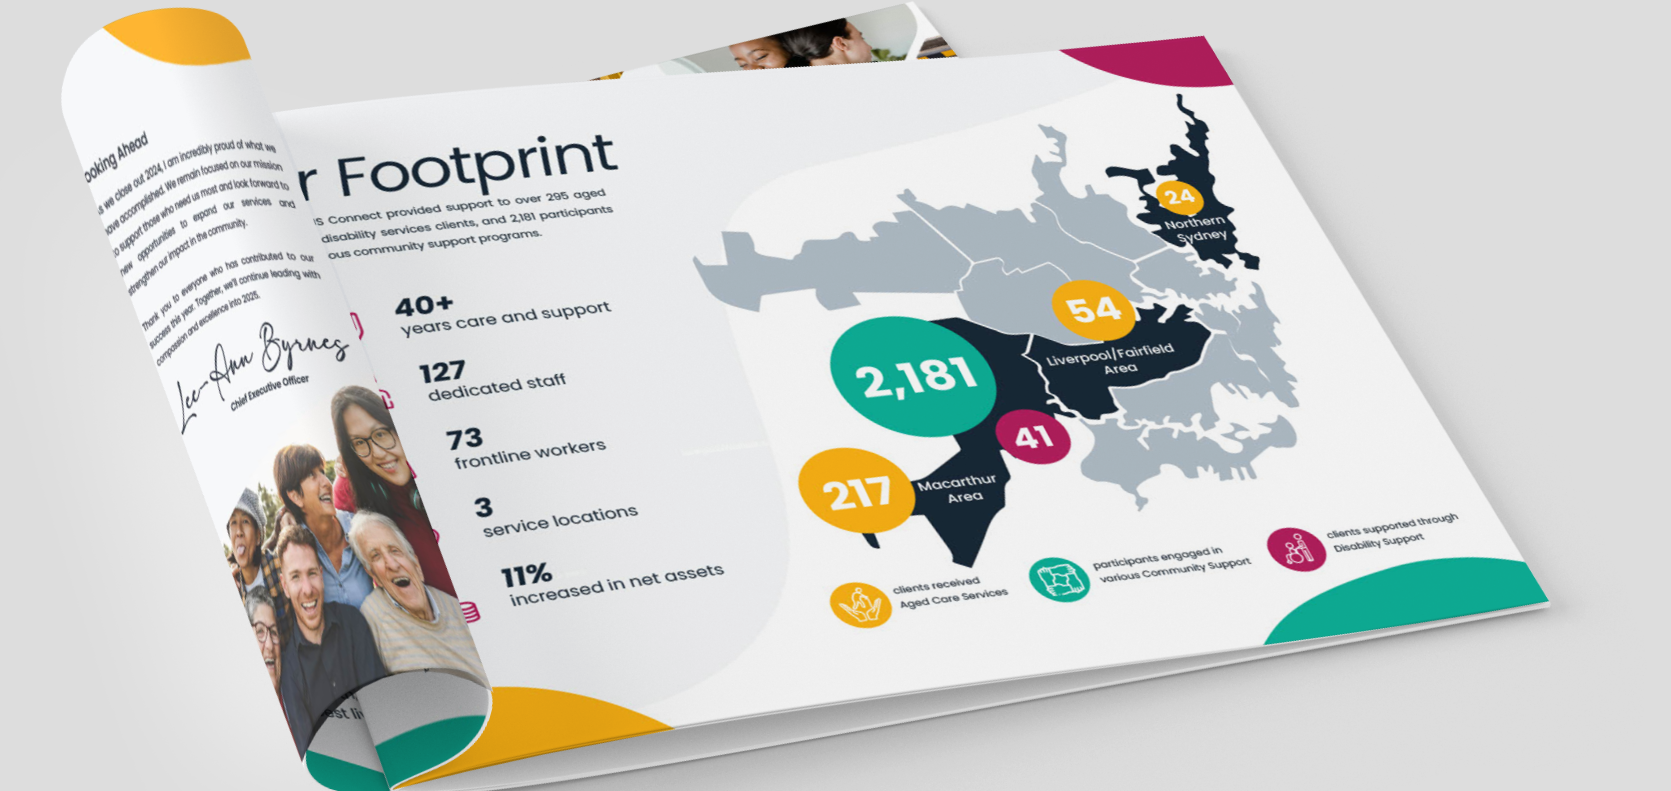
6. Use of Infographics and Data Visualisation
Data visualisation helps convey complex information in a more digestible way. Instead of dense paragraphs of text, infographics can turn statistics and achievements into engaging visuals. This makes the report more interactive and easier for the reader to grasp.
Examples:
- Timeline graphics to show the organisation’s achievements over the year.
- Infographics to display volunteer hours, funds raised, or community impact.
- Maps to show geographical reach or areas served by your charity.
7. Highlight Key Achievements
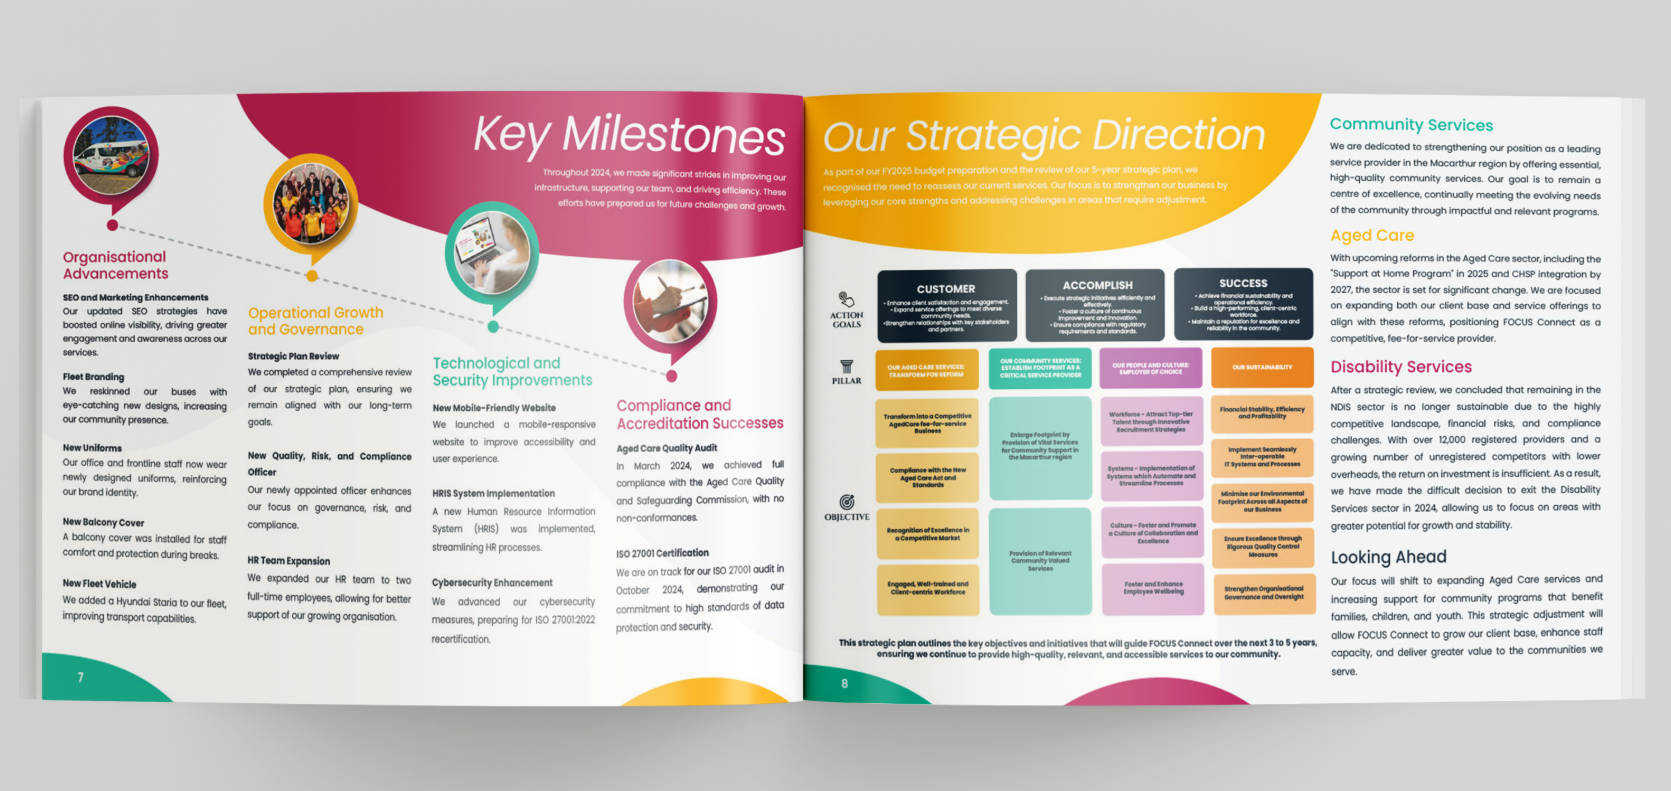
It’s important to highlight your organisation’s major milestones and accomplishments over the past year. Dedicate a section to “Highlights” that quickly shows the reader what your organisation has achieved, using a mix of visuals and text.
- Use bold numbers to call out metrics, such as funds raised or beneficiaries reached.
- Include awards or recognition your organisation received.
- Showcase collaborative projects with other organisations.
8. Include Calls to Action
An annual report can also be an opportunity to inspire future involvement. Whether it’s through donations, volunteering, or advocacy, include clear calls to action (CTAs) that encourage readers to engage with your organisation.

Final Thoughts
An annual report is more than just a regulatory requirement; it’s an opportunity to communicate your company’s story, achievements, and vision. By focusing on audience needs, maintaining consistency, and paying attention to design elements, you can create a report that resonates with your audience and strengthens trust in your organisation.
In addition to our stunning website designs, Love My Online Marketing offers a range of add-on services, including annual report copywriting and design, to support your organisation’s communication efforts. Our comprehensive web design packages also include logo design, business cards, email signatures, email marketing, brochures, packaging, and other marketing materials. Get in touch with us today.


Love My Online Marketing has 10+ Years of working alongside businesses and helping them grow. Discuss your options for online success from website Design and Development through to Google Marketing.
Do you want more traffic and business leads?
Love My Online Marketing is determined to make a business grow. Our only question is, will it be yours?